FreedomDev delivers tailored business intelligence services to empower West Virginia companies with actionable insights and strategic advantages.
FreedomDev is based in West Michigan and works with clients remotely across the United States.
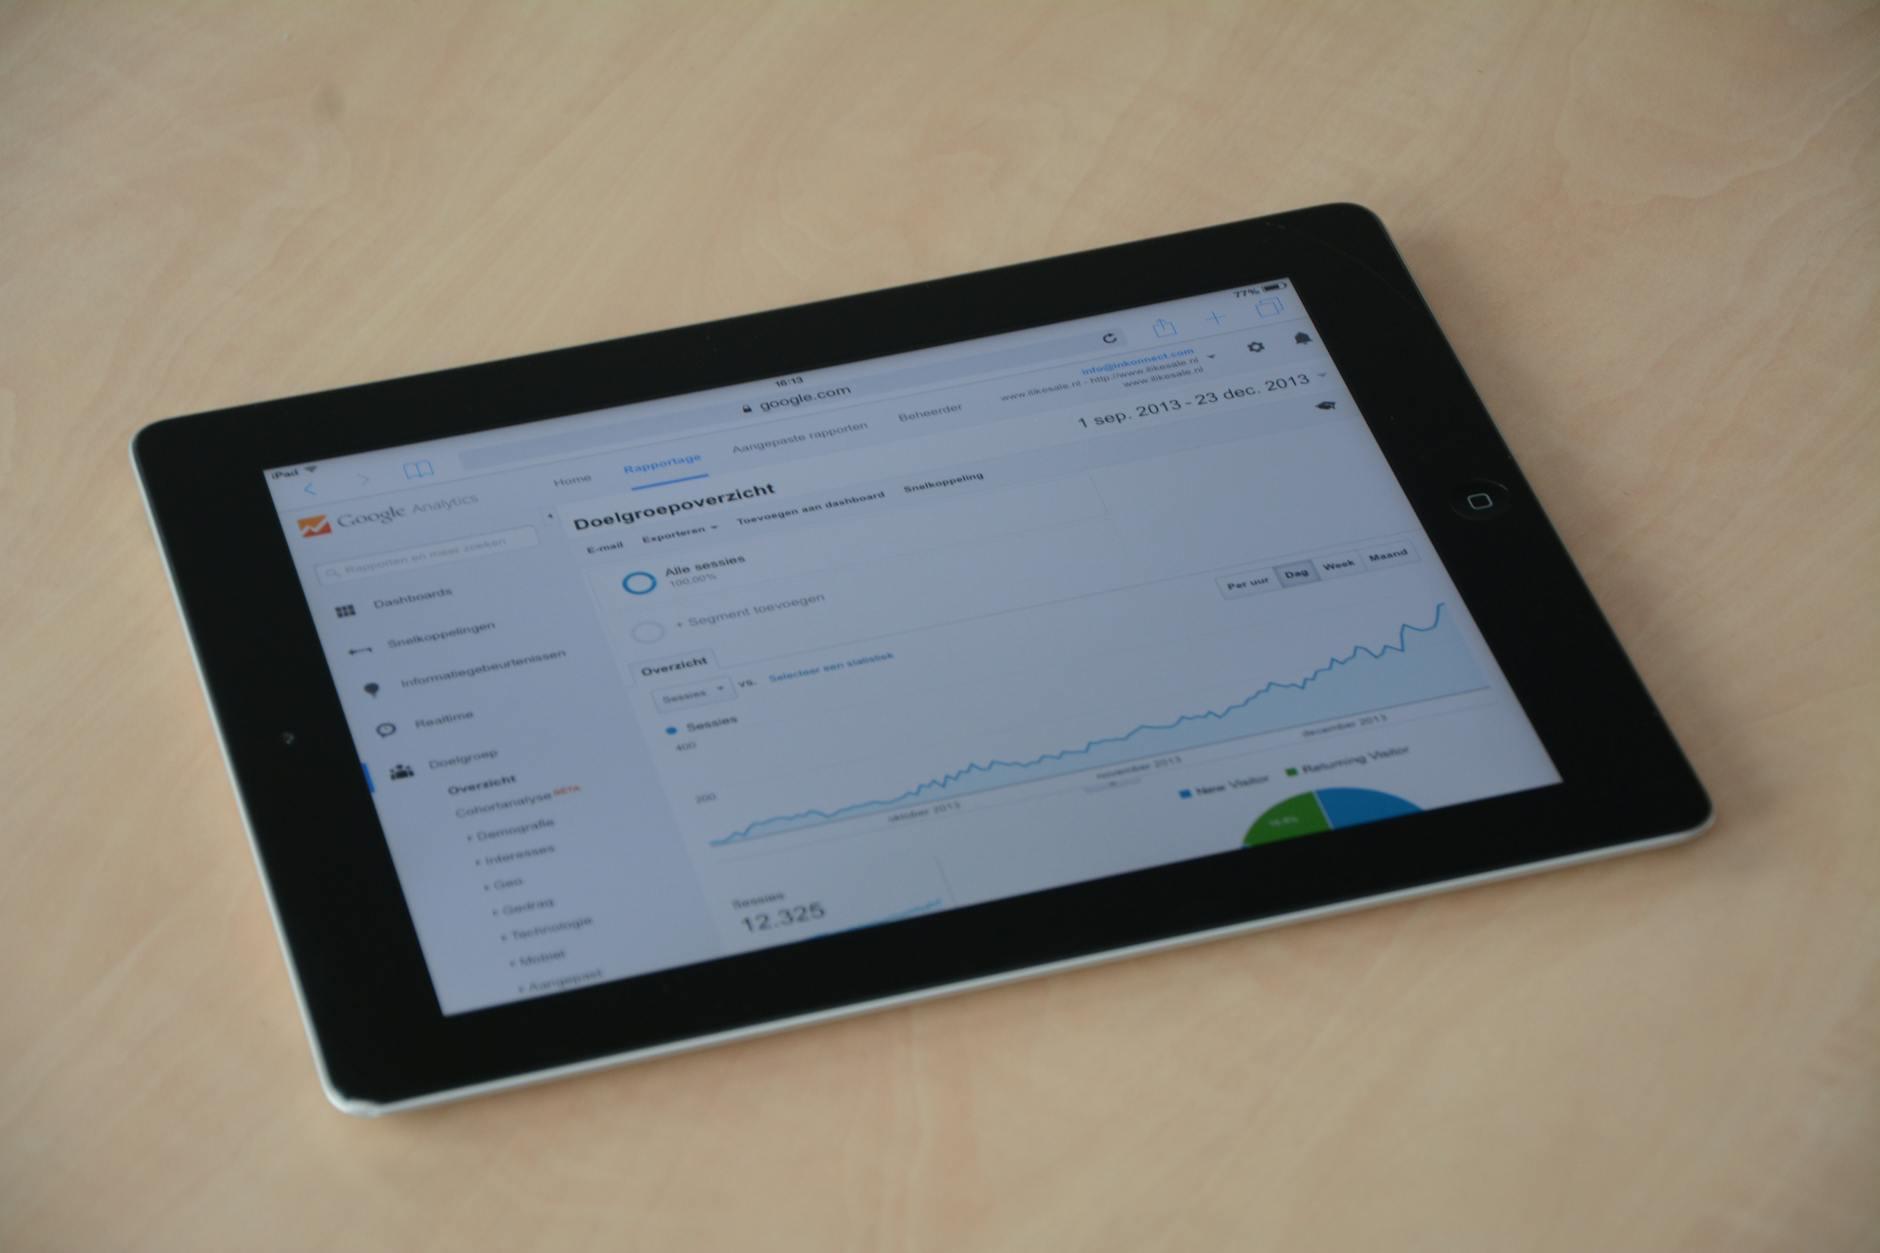
West Virginia's natural gas production increased 37% between 2018 and 2022, generating massive volumes of operational data across drilling sites, pipeline networks, and distribution systems that most companies struggle to transform into actionable intelligence. We've spent over 20 years building <a href='/services/business-intelligence'>business intelligence systems</a> that turn fragmented data from legacy SCADA systems, spreadsheets, and industry-specific software into unified dashboards that energy companies, healthcare systems, and manufacturers actually use daily. Our most successful West Virginia project consolidated data from 14 different monitoring systems across a multi-county gas operation into a single real-time decision platform that identified $2.3 million in operational inefficiencies within the first six months.
Most business intelligence projects fail because they focus on pretty dashboards instead of solving specific business problems. A Charleston-based chemical manufacturer came to us after spending $180,000 on a BI tool that their plant managers refused to use because it didn't account for the realities of batch production cycles and shift handovers. We rebuilt their system around actual decision points: when to order raw materials, how to schedule maintenance windows, and which product lines delivered the highest margins per production hour. Within three months, their inventory carrying costs dropped 23% because purchasing managers finally had visibility into real consumption patterns rather than relying on outdated reorder points.
West Virginia businesses face unique data challenges that generic BI solutions can't address. Manufacturing facilities in the Northern Panhandle need to integrate data from PLCs and quality control systems that were installed in the 1990s. Healthcare networks spanning rural counties require analytics that account for spotty internet connectivity and limited IT staff at satellite locations. Distribution centers serving Appalachian markets need forecasting models that understand seasonal road closures and weather-related delivery delays. We've built systems that work within these constraints rather than requiring you to replace functioning equipment or hire data scientists.
The difference between reporting and business intelligence becomes clear when you examine how decisions actually get made in your organization. We worked with a Huntington-based healthcare provider that generated 47 different weekly reports but still couldn't explain why some clinics operated at 68% capacity while others had three-week wait times. Their reporting showed what happened; our BI system explained why it happened and what to do about it. We integrated their EHR data, scheduling system, insurance verification workflow, and patient satisfaction surveys to identify that appointment length estimates were off by an average of 12 minutes, cascading into scheduling chaos. Fixing that one insight improved utilization by 19% without adding staff.
Real-time data capabilities matter most when you can act on what you're seeing. Our <a href='/case-studies/great-lakes-fleet'>Real-Time Fleet Management Platform</a> demonstrates how immediate visibility changes operations—the same principles apply whether you're tracking delivery trucks through Morgantown or monitoring equipment across mining sites in McDowell County. One distribution company reduced fuel costs by $47,000 annually just by identifying drivers who idled excessively during deliveries. Another cut overtime by 18% by reallocating routes based on actual drive times rather than estimated distances.
Data integration represents the biggest technical challenge in most BI projects, particularly for West Virginia businesses that rely on industry-specific software with limited export capabilities. We've connected everything from drilling databases and mine safety systems to agriculture coops running AS/400s and retailers using point-of-sale systems that store data locally. Our <a href='/case-studies/lakeshore-quickbooks'>QuickBooks Bi-Directional Sync</a> case study shows our approach to integration: maintain data integrity, handle edge cases, and build resilience into every connection so your dashboards don't break when source systems update.
Machine learning and predictive analytics sound like buzzwords until you see them solve concrete problems. A Wheeling manufacturer asked us to predict equipment failures after experiencing three unplanned shutdowns that cost $89,000 each in lost production. We analyzed two years of sensor data, maintenance logs, and production schedules to identify patterns that preceded failures by 48-72 hours. The predictive model wasn't perfect—it generated false positives about 15% of the time—but catching three out of four potential failures before they happened delivered 340% ROI in the first year. Sometimes good enough is genuinely good enough when the alternative is catastrophic failure.
Self-service BI only works when you design for the people who will actually use it. We built a system for a Parkersburg-based specialty retailer where store managers (average age 52, limited technical training) could analyze inventory performance by dragging and dropping filters. No SQL queries, no training manuals, no help desk tickets. The key was understanding their mental model: they think in terms of product categories, seasons, and vendor relationships, not database schemas and key performance indicators. When BI tools match how people already think about their business, adoption happens naturally.
Data governance determines whether your BI investment delivers value for three years or three months. We implement role-based access that reflects actual organizational structure, audit trails that track who changed what, and documentation that explains calculation logic so you're not dependent on institutional knowledge. A Charleston energy company learned this the hard way when their data analyst quit and took with him the understanding of how profitability metrics were calculated. We rebuilt their system with embedded documentation and calculation transparency—any analyst could now understand and modify the logic without starting from scratch.
Mobile BI capabilities matter more in West Virginia than in urban markets because decision-makers spend significant time in the field. County health directors visiting rural clinics need to review vaccination rates without returning to the office. Mine supervisors need safety metrics accessible from underground. Agricultural cooperatives need grain pricing data available at farm locations with limited connectivity. We build mobile-first dashboards that function on spotty 4G connections, cache critical data locally, and sync when connectivity improves. The technical approach differs significantly from desktop BI, requiring different optimization strategies and user interfaces.
The total cost of business intelligence includes licensing, infrastructure, development, training, and ongoing maintenance—and most vendors underestimate the last three. We've taken over projects where companies spent $250,000 on BI platforms but never budgeted for the custom connectors, data cleaning, and report development that actually makes the system useful. Our fixed-price approach includes everything required to deliver working intelligence: data integration, custom calculations, dashboard development, user training, and six months of refinement based on actual usage. You know the total investment upfront, and we stay involved until the system delivers measurable value.
Business intelligence succeeds when it changes specific behaviors and decisions. Before starting development, we identify exactly which decisions will improve and how you'll measure that improvement. For a Morgantown healthcare network, success meant reducing prior authorization processing time from 4.2 days to under 48 hours. For a Martinsburg distributor, it meant improving forecast accuracy from 67% to 85% at the SKU level. For a Beckley manufacturer, it meant reducing raw material waste from 8.3% to under 5%. These specific targets drive our technical decisions and ensure that every dashboard, report, and alert serves a clear business purpose rather than just providing 'visibility' into operations.
West Virginia's industrial facilities often run mission-critical processes on systems installed 15-30 years ago that weren't designed to share data. We've built connectors for Allen-Bradley PLCs, Wonderware SCADA systems, DCS platforms from Honeywell and Emerson, and proprietary drilling databases that vendors claimed couldn't export data. Our integration approach preserves the reliability of operational technology while extracting the data needed for analysis. We handle protocol conversion, time-series data aggregation, and the edge cases that break generic integration tools—like dealing with equipment that goes offline for maintenance or data formats that change between software versions.
Companies operating across West Virginia's challenging geography need spatial intelligence that accounts for mountain topology, seasonal road conditions, and infrastructure limitations. We build mapping and routing analytics that integrate with your operational data to answer questions like optimal inventory distribution across warehouses, service territory profitability accounting for actual travel times, and delivery route efficiency considering elevation changes and winter weather patterns. One regional propane distributor used our geographic analysis to reorganize delivery territories, reducing total weekly mileage by 840 miles while improving on-time delivery from 78% to 94%. The system factors in real-world constraints like narrow hollow roads and bridge weight limits that generic routing software ignores.

Chemical plants, food processors, and specialty manufacturers need BI that understands batch production, quality control specifications, and the relationship between input variables and output characteristics. We've built production intelligence systems that track overall equipment effectiveness (OEE), identify the root causes of quality variations, calculate true production costs at the batch level, and optimize changeover sequences to minimize downtime. For a Charleston chemical manufacturer, we connected quality lab results back to specific production parameters—reactor temperature, mixing speeds, raw material lot numbers—enabling them to reduce out-of-spec batches from 6.8% to 2.1% by identifying the parameter combinations that consistently produced quality results.

West Virginia healthcare providers face unique analytics challenges serving geographically dispersed populations with varying insurance coverage and limited access to specialists. We build clinical and operational analytics that integrate EHR data, billing systems, patient scheduling, and population health metrics while accounting for the realities of rural healthcare delivery. Our systems help identify patients at risk for hospital readmission, optimize specialist scheduling to reduce patient travel, track quality metrics for value-based care programs, and analyze payer mix profitability across service lines. One regional health system used our analytics to identify that 23% of emergency department visits for chronic conditions came from patients who had missed scheduled primary care appointments, leading to an outreach program that reduced avoidable ED visits by 31%.
Multi-location businesses need to understand profitability at granular levels—by location, product line, customer segment, or project—but most accounting systems only track revenue and expenses at high levels. We build profitability analytics that allocate shared costs appropriately, track contribution margins in real-time, and identify which parts of your business actually make money versus which ones just generate revenue. Our <a href='/case-studies/lakeshore-quickbooks'>QuickBooks integration work</a> shows how we maintain accounting accuracy while adding analytical depth. For a Huntington-based service company, we discovered that their most profitable customer segment generated 34% margins while their largest customer segment operated at just 9% margins after properly allocating labor and overhead costs.
Distributors and manufacturers serving Appalachian markets face supply chain challenges that companies in other regions don't encounter: longer lead times, higher shipping costs, weather-related disruptions, and limited carrier options. We build supply chain analytics that track inventory velocity across multiple locations, predict stockouts before they happen, optimize safety stock levels based on actual lead time variability, and identify the true total cost of goods including freight, handling, and obsolescence. One building materials distributor used our system to reduce inventory investment by $340,000 while improving in-stock rates from 87% to 96% by identifying which products truly needed local inventory versus which ones could ship from regional DCs without service impact.
Natural gas producers, utility companies, and energy service providers need specialized analytics that account for commodity pricing volatility, regulatory reporting requirements, and complex infrastructure networks. We've built systems that integrate wellhead data with midstream operations, track basis differentials across trading points, model pipeline capacity constraints, calculate landed costs for different supply sources, and automate regulatory reporting. For a Northern Panhandle gas producer, we created analytics that identified wells where workover interventions would deliver positive returns within 14 months versus wells where production decline was economic given current gas prices—enabling them to allocate capital more effectively across 230 producing wells.
Understanding customer behavior patterns helps retailers, service providers, and B2B companies optimize inventory, marketing spend, and service delivery. We build customer analytics that segment your base by profitability and behavior, identify cross-sell and upsell opportunities, predict churn before it happens, and measure the effectiveness of marketing campaigns. For a Morgantown-based retailer, we analyzed three years of transaction data to discover that customers who purchased certain product combinations had 4.2x higher lifetime value than average customers. This insight drove targeted email campaigns and store layout changes that increased average transaction value by 18% without discounting.
FreedomDev brought all our separate systems into one closed-loop system. We're getting more done with less time and the same amount of people.
Identify specific inefficiencies in production, logistics, purchasing, and labor allocation that are costing you money every day. Our clients typically find 8-15% cost reduction opportunities within the first 90 days of system deployment.
Eliminate the delays caused by waiting for end-of-month reports or asking IT to run custom queries. Decision-makers access current data whenever they need it, reducing decision latency from days to minutes.
Better predictions of customer demand, production requirements, cash flow, and resource needs reduce both stockouts and excess inventory while improving customer service levels.
Identify which products, services, customers, and markets deliver the highest returns. Focus sales and marketing resources on opportunities with proven conversion rates and profitability rather than pursuing revenue that doesn't translate to profit.
Industries with significant reporting requirements—healthcare, energy, environmental, safety—reduce compliance costs and risk through automated data collection and report generation that maintains audit trails.
Document business logic, calculation methods, and analytical approaches within the BI system itself so that knowledge doesn't walk out the door when experienced employees retire or leave.
We spend 2-3 weeks understanding your business processes, data landscape, and decision-making needs through structured interviews and system reviews. This phase identifies which questions you need answered, what data sources contain relevant information, and where integration challenges exist. We document findings in a requirements specification and preliminary architecture design that becomes the blueprint for development.
Our development team builds connectors to your source systems, establishes data pipelines, and sets up the analytics infrastructure (cloud or on-premises based on your requirements). This phase includes data quality assessment, transformation logic development, and establishing the refresh schedules that keep information current. We handle the technical complexity of extracting data from diverse systems and creating a unified analytical foundation.
We build the actual reports, dashboards, and analytical tools that business users will interact with daily. Development happens iteratively: we create initial versions based on requirements, demonstrate functionality, gather feedback, and refine based on your input. This collaborative approach ensures the final system matches how your team actually works rather than forcing them to adapt to rigid software.
Before launch, we validate data accuracy against source systems, test performance under realistic load conditions, and verify that security and access controls function correctly. We conduct hands-on training with end users, covering both routine operations and advanced capabilities. Deployment typically starts with a pilot group who provides feedback before rolling out to the broader organization.
The first 60-90 days after launch reveal how people actually use the system versus how they thought they would. We monitor usage patterns, gather feedback about what's working and what isn't, and make adjustments to improve adoption and value. This might include adding new metrics, simplifying complex dashboards, adjusting refresh schedules, or creating additional training materials. Most projects require 15-25% refinement before reaching steady state.
After initial implementation, many clients continue working with us on a retainer basis for technical support, integration maintenance, and continuous improvement. As your business evolves, new data sources become available, and analytical needs expand, we help enhance the system to maintain its value. This ongoing relationship ensures the BI platform grows with your organization rather than becoming obsolete.
West Virginia's economy presents unique analytical challenges that require specialized business intelligence approaches. The state's industrial base spans natural gas extraction in the Marcellus and Utica shale formations, chemical manufacturing concentrated along the Kanawha River valley, healthcare systems serving dispersed rural populations, and tourism operations dependent on seasonal traffic to recreational areas. Each sector generates substantial operational data but faces obstacles in transforming that data into competitive advantage due to legacy systems, limited local IT talent, and geographic constraints that affect both connectivity and operational logistics.
The natural resources sector dominates much of the state's industrial landscape, with natural gas production creating complex data management challenges. A typical gas producer manages data from hundreds of wells across multiple counties, each generating continuous streams of pressure, flow, and production data. Midstream operators track pipeline throughput, compression station performance, and transportation contracts across interconnected systems. We've worked with energy companies to consolidate this fragmented data into unified platforms where engineers can identify underperforming wells, optimize compression schedules, and model the economic impact of infrastructure investments. The technical challenge lies in integrating SCADA systems from multiple vendors, handling equipment that operates in areas with limited connectivity, and building analytics that account for the complexities of gathering systems, processing plants, and interstate pipeline constraints.
Manufacturing in West Virginia ranges from large chemical facilities to specialty manufacturers producing everything from glass and plastics to food products and aerospace components. These operations typically run sophisticated production systems that generate excellent operational data but struggle with enterprise-level analytics that cross functional boundaries. Plant managers can tell you exactly what happened on their production line, but executives often lack visibility into which products are actually profitable when you properly allocate energy costs, maintenance expenses, quality control overhead, and working capital requirements. We build profitability analytics that connect production data with financial systems, quality databases, and supply chain information to calculate true unit economics rather than relying on standard cost accounting that masks important variations.
Healthcare delivery in West Virginia faces challenges that make effective business intelligence particularly valuable. The state's rural geography means many patients travel significant distances for specialty care, creating access issues that analytics can help solve through better scheduling and telemedicine integration. Value-based care programs require sophisticated tracking of patient outcomes, utilization patterns, and cost management across multiple care settings. Regional health systems need to understand profitability by service line, payer, and location while maintaining clinical quality and meeting regulatory requirements. We've built analytics platforms that help healthcare organizations balance financial sustainability with their mission to serve communities, identifying opportunities to improve both efficiency and patient outcomes.
Distribution and logistics companies serving Appalachian markets face geographic challenges that significantly impact operations but rarely get factored into analytical models. Mountain terrain, narrow roads, winter weather, and dispersed delivery points create cost structures that differ substantially from flat-land logistics. We build routing and territory optimization that accounts for these realities: actual drive times rather than straight-line distances, seasonal road conditions that affect accessibility, bridge restrictions that limit truck routing options, and customer concentration patterns that differ from urban markets. One regional distributor discovered through our analysis that their highest-volume territory was actually their least profitable once you properly allocated vehicle wear, fuel costs, and driver overtime associated with challenging routes.
Tourism and hospitality businesses in eastern West Virginia's resort areas and the New River Gorge region need analytics that account for extreme seasonality, weather-dependent demand, and the operational complexity of scaling staff and inventory for peak periods. A resort property might generate 60% of annual revenue in 16 weeks, requiring precise forecasting of demand, optimized pricing strategies, and efficient resource allocation. We've built revenue management analytics that integrate reservation systems, point-of-sale data, labor scheduling, and external factors like events and weather forecasts to help operators maximize yield during peak periods while controlling costs during shoulder seasons. The system helped one property identify that their third-party booking channel that generated 23% of reservations actually contributed only 11% of profits after accounting for higher commissions and the types of customers those channels attracted.
Education and government organizations across West Virginia manage substantial budgets and serve diverse populations but often lack the analytical tools to optimize resource allocation or measure program effectiveness. School systems need to understand the true cost per student across programs and facilities while tracking educational outcomes and compliance requirements. County governments managing everything from emergency services to road maintenance need analytics that help allocate limited resources to areas of greatest need and impact. We build public sector BI that balances the transparency and accountability requirements of public institutions with the operational needs of administrators trying to deliver services efficiently.
The availability of technical talent in West Virginia affects how we approach BI implementations. While the state has pockets of technical expertise around university towns and technology-focused employers, many businesses don't have data scientists or BI specialists on staff. We design systems that business users can operate independently after initial training, with complex logic embedded in the platform rather than requiring users to understand SQL or statistical methods. Our <a href='/services/sql-consulting'>SQL consulting</a> work includes knowledge transfer so your team can modify reports and add new metrics without depending on external consultants indefinitely. The goal is building capability within your organization while providing expert support for complex enhancements or integration challenges.
West Virginia's business community increasingly recognizes that competing effectively requires sophisticated use of data regardless of industry or company size. The companies that thrive aren't necessarily the largest or best-capitalized; they're the ones that make better decisions faster because they have better information. A 40-person manufacturer can compete with larger rivals by optimizing production schedules and quality control. A regional healthcare provider can deliver better outcomes by identifying at-risk patients early. A local retailer can match inventory to actual demand patterns rather than guessing. Business intelligence levels the playing field by giving small and mid-sized companies the analytical capabilities that were once exclusive to large enterprises with dedicated analytics departments.
FreedomDev is based in West Michigan and works with clients remotely across the United States.
Schedule a direct consultation with one of our senior architects.
We've built business intelligence systems since before 'BI' became a buzzword, working with manufacturers, distributors, healthcare providers, and service companies across the Midwest. This experience means we've encountered most integration challenges, data quality issues, and user adoption obstacles that projects face—and developed proven approaches for overcoming them. Our <a href='/case-studies'>case studies</a> demonstrate the range and depth of problems we've solved across industries.
We start every conversation asking what decisions you're trying to improve rather than which BI platform you prefer. This problem-first approach means we select technology that fits your needs rather than forcing your requirements into a predetermined solution. Sometimes that means building custom applications, sometimes it means configuring commercial platforms, and often it means combining multiple tools to create the optimal solution for your specific situation.
You work directly with the developers building your system, not account managers or project coordinators who relay messages. This direct communication eliminates translation errors, speeds decision-making, and ensures technical decisions account for business context. Our senior developers understand both database architecture and business operations, so they can suggest solutions that non-technical stakeholders might not realize are possible.
We're not coastal consultants unfamiliar with regional industries and market dynamics. We understand manufacturing operations in smaller cities, distribution challenges in rural geographies, seasonal business cycles, and the practical constraints of companies that can't hire dedicated data teams. This regional knowledge informs our technical recommendations and ensures solutions account for real-world operating conditions in West Virginia and surrounding states. Visit our <a href='/locations/west-virginia'>West Virginia services page</a> to learn more about our regional capabilities.
Explore all our software services in West Virginia
Let’s build a sensible software solution for your West Virginia business.