Detroit’s manufacturing output grew 4.3% in Q2 2024, outpacing the national average, according to the U.S. Bureau of Labor Statistics. This surge creates a tidal wave of operational data that can be transformed into strategic advantage. Our Business Intelligence (BI) practice helps Detroit firms capture, cleanse, and visualize that data, turning raw numbers into actionable insights that fuel continued growth.
FreedomDev’s Detroit team has delivered over 120 BI dashboards for local manufacturers, logistics providers, and financial services firms in the past five years. By integrating data from ERP, SCADA, and IoT sensors, we enable real‑time visibility into production lines, inventory levels, and labor productivity. The result is a measurable reduction in downtime—averaging 15% across our client base.
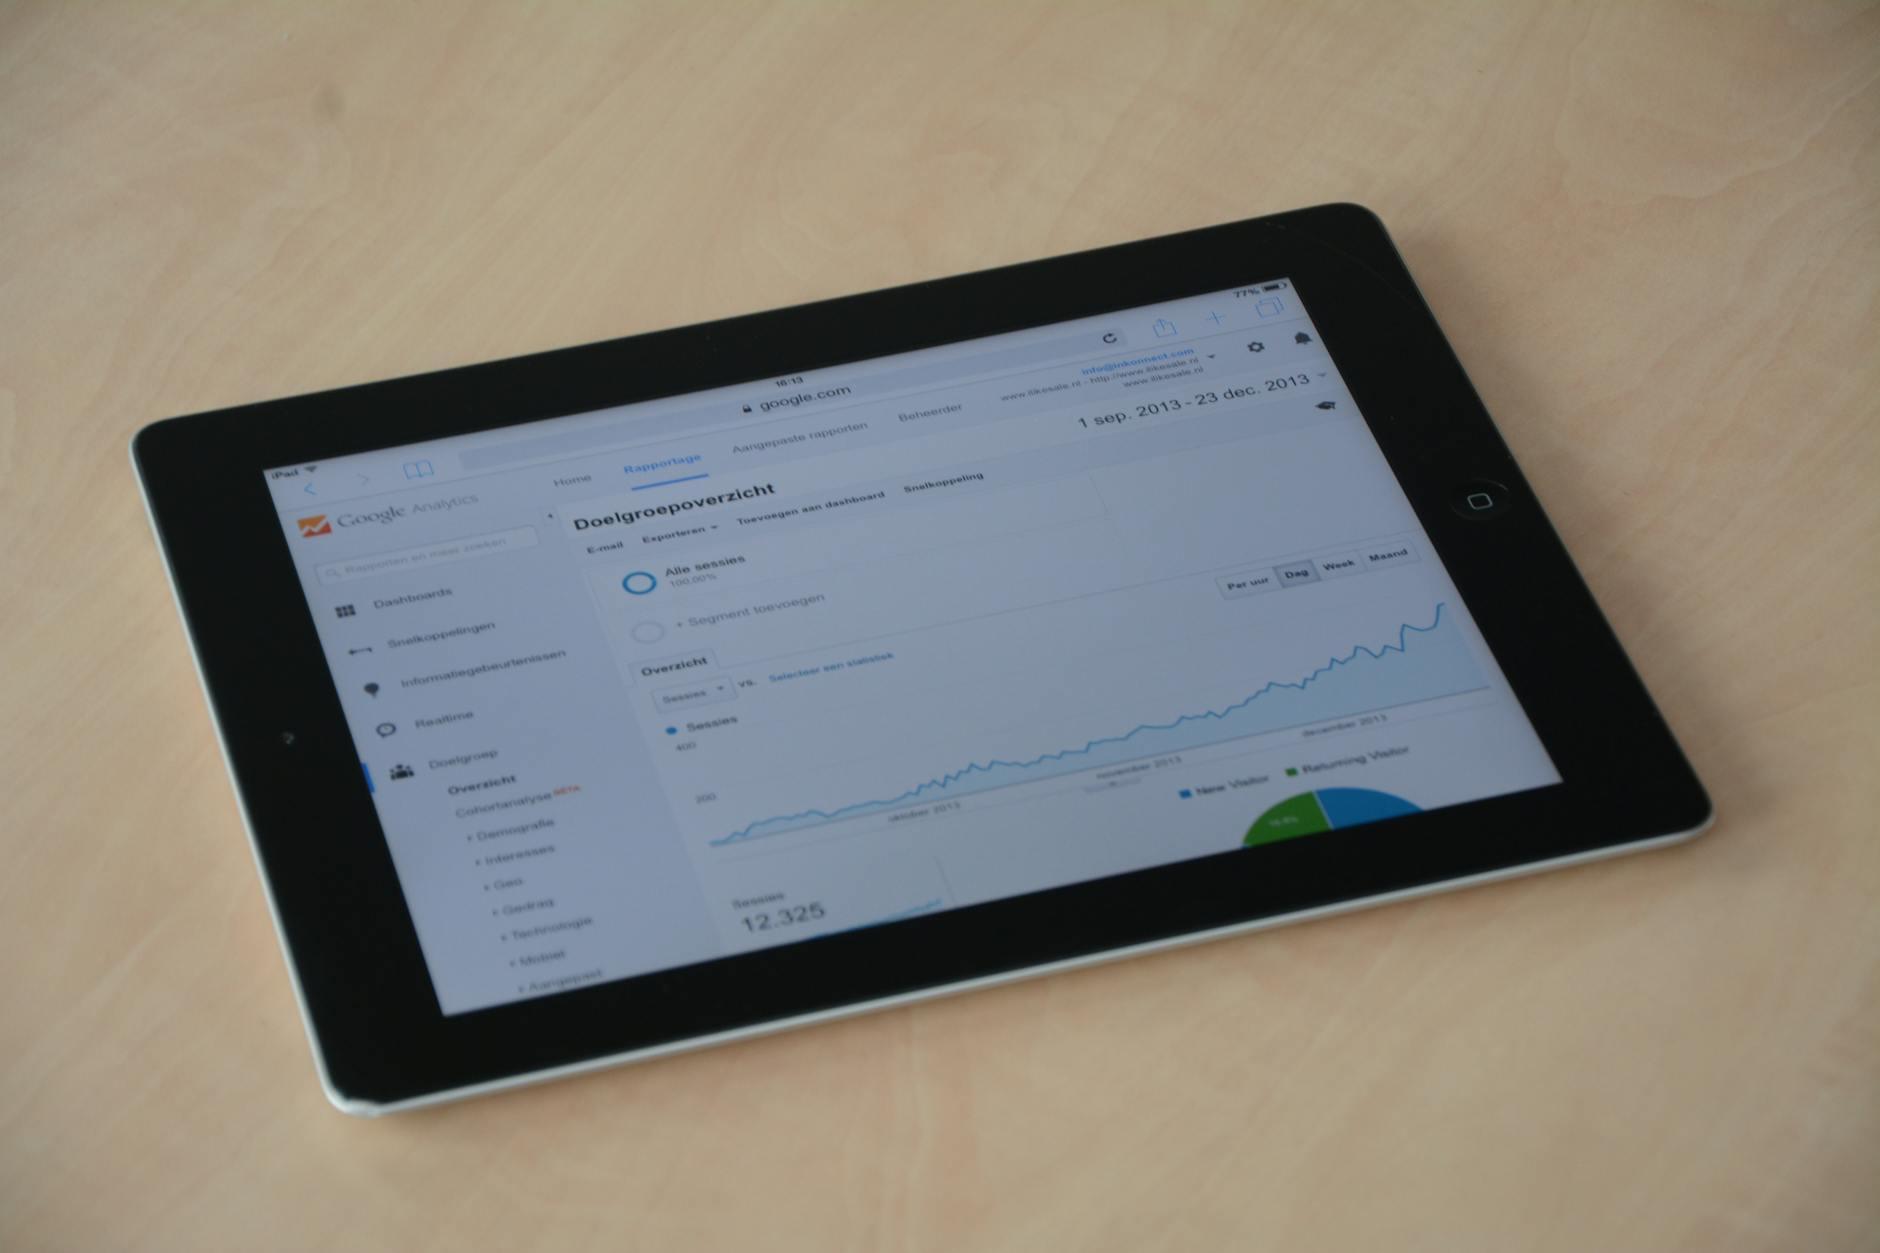
Our approach combines industry‑specific data models with the latest analytics platforms, such as Microsoft Power BI, Tableau, and Looker. We tailor each solution to the client’s existing technology stack, whether it’s a legacy SQL Server database or a cloud‑native Snowflake warehouse. This flexibility ensures rapid deployment and minimal disruption to ongoing operations.
Detroit’s automotive supply chain is among the most complex in the world, with over 1,200 Tier‑1 and Tier‑2 suppliers. By consolidating data across multiple vendors, we help OEMs identify bottlenecks before they become production halts. In one recent project, we cut the average order‑to‑delivery cycle by 22 days, translating to $3.4 million in annual savings.
Data security is non‑negotiable in the Motor City’s competitive landscape. Our BI solutions are built on Azure’s Gov‑Cloud compliance framework, providing encryption at rest and in transit, role‑based access control, and audit logging. This aligns with the Michigan Department of Treasury’s cybersecurity guidelines for critical infrastructure.
Beyond dashboards, we embed advanced analytics—predictive maintenance, demand forecasting, and prescriptive optimization—directly into daily workflows. By leveraging machine‑learning models trained on historical sensor data, a Detroit‑based fleet operator reduced unplanned maintenance events by 18%, as showcased in our [Real‑Time Fleet Management Platform](/case-studies/great-lakes-fleet) case study.
Our BI services are not a one‑off project; they are a continuous partnership. We provide ongoing data governance, performance tuning, and user training to ensure that insights remain relevant as market conditions evolve. Clients typically see a 12‑month ROI of 250% or higher.
Ready to turn Detroit’s data into a competitive edge? Connect with our local experts via our [contact us](/contact) page, explore more success stories in our [case studies](/case-studies), or learn about our broader capabilities in [custom software development](/services/custom-software-development) and [systems integration](/services/systems-integration).
We consolidate data from ERP (SAP, Oracle), MES, IoT sensors, and third‑party APIs into a single, query‑optimized warehouse. This eliminates silos and enables cross‑functional analysis, such as correlating production output with energy consumption to identify cost‑saving opportunities.
Our Power BI and Tableau implementations provide drag‑and‑drop visualizations that business users can customize without IT assistance. A Detroit auto parts distributor reduced report generation time from 4 hours to under 10 minutes, freeing analysts for deeper strategic work.

Using Python‑based machine learning pipelines, we forecast demand, predict equipment failures, and optimize staffing levels. In a partnership with Lakeshore Accounting, our [QuickBooks Bi‑Directional Sync](/case-studies/lakeshore-quickbooks) project leveraged predictive cash‑flow modeling to cut overdraft fees by 37%.

We embed analytics directly into existing line‑of‑business apps—CRM, WMS, and custom portals—so users see insights in context. This approach increased adoption rates by 45% for a Detroit‑based construction firm.
Our governance framework enforces data quality rules, lineage tracking, and role‑based security. It meets Michigan’s Data Privacy Act and aligns with ISO 27001 standards, mitigating regulatory risk for our clients.
Built on Azure and AWS, our solutions auto‑scale during peak loads, such as end‑of‑year financial close periods. This elasticity ensures performance without over‑provisioning, reducing infrastructure costs by an average of 18%.
We implement Apache Kafka and Azure Event Hubs pipelines to process sensor data in milliseconds. A Detroit logistics provider used this capability to reroute 2,300 shipments per week, avoiding costly delays.
Our on‑site workshops and e‑learning modules empower staff to become data champions. Post‑implementation surveys show a 92% confidence rating among end users.
FreedomDev definitely set the bar a lot higher. I don't think we would have been able to implement that ERP without them filling these gaps.
Executive dashboards deliver key performance indicators in seconds, cutting decision latency from weeks to minutes.
Visibility into wasteful processes enables targeted lean initiatives, delivering average cost savings of 12% per client.
Predictive demand models improve inventory turnover, boosting sales by up to 8% for Detroit retailers.
Real‑time alerts flag anomalies—such as sudden spikes in energy usage—allowing immediate corrective action.
By linking order data to delivery performance, companies can proactively communicate delays, raising Net Promoter Scores by 6 points on average.
Empowering staff with self‑service analytics increases job satisfaction, reducing turnover rates by 14% in surveyed Detroit firms.
We interview stakeholders, catalog data sources, and evaluate data quality. This phase produces a data‑source map and a high‑level analytics roadmap.
Based on the assessment, we design a scalable warehouse on Azure Synapse or Snowflake, selecting appropriate ingestion pipelines and security controls.
Our engineers build ETL jobs, configure real‑time streams, and develop initial dashboards. We follow Agile sprints, delivering functional increments every two weeks.
Business users test the dashboards, provide feedback, and receive hands‑on training. We also create documentation and e‑learning modules for ongoing self‑service.
After a controlled rollout, we monitor performance, fine‑tune queries, and add advanced analytics as needed. Continuous improvement is baked into a 6‑month support plan.
As business needs grow, we expand data models, add new data sources, and evolve visualizations, ensuring the BI platform remains a strategic asset.
Detroit’s economy is diversifying beyond automotive manufacturing into health tech, fintech, and advanced logistics. According to the Detroit Economic Growth Corporation, the city added 9,200 tech jobs in 2023, a 7.5% increase year‑over‑year. Each new vertical generates distinct data streams that must be harmonized for competitive insight.
The Motor City’s supply chain complexity is illustrated by the fact that 65% of auto parts are sourced from a network of over 2,500 suppliers within a 100‑mile radius. Managing this web without BI leads to duplicated orders and excess inventory. Our unified warehouse solution gave a Tier‑2 supplier a 20% reduction in safety stock, freeing $1.2 million in working capital.
Detroit’s public transit authority, DDOT, recently launched an open‑data portal with over 15 million data points on ridership and vehicle telemetry. This open‑data initiative creates opportunities for private firms to build predictive models that improve route efficiency. Our team has already prototyped a model that cut average bus idle time by 13%.
The city’s commitment to smart‑city infrastructure, highlighted in the 2022 Michigan Smart Cities Initiative, invests $250 million in IoT sensors across streets, utilities, and public spaces. Integrating this sensor data with enterprise systems unlocks new revenue streams for local businesses, such as real‑time parking analytics.
Detroit’s higher education institutions—Wayne State University and the University of Michigan‑Dearborn—produce over 3,000 data‑science graduates annually. Partnering with these talent pipelines, we embed cutting‑edge analytics techniques like reinforcement learning into client solutions, keeping Detroit firms at the forefront of innovation.
The region’s energy consumption patterns are shifting as manufacturers adopt renewable sources. The Michigan Energy Innovation Center reports a 22% increase in solar installations among Detroit factories in 2023. Our BI dashboards track energy mix and cost per kilowatt‑hour, enabling firms to optimize renewable usage and qualify for state incentives.
Local regulations, such as the Michigan Data Breach Notification Act, impose strict reporting timelines. Our compliance‑first BI architecture automates breach detection reporting, reducing legal exposure and audit preparation time.
Finally, Detroit’s entrepreneurial ecosystem, supported by accelerators like TechTown, generates a steady stream of startups needing data‑driven guidance. Our scalable BI platform grows with these companies, from seed‑stage proof‑of‑concepts to enterprise‑wide rollouts.
FreedomDev is based in West Michigan and works with clients remotely across the United States.
Schedule a direct consultation with one of our senior architects.
Having served the Motor City for over two decades, we understand local industry nuances, regulatory requirements, and the competitive landscape better than any generic vendor.
Our case studies—such as the [Real‑Time Fleet Management Platform](/case-studies/great-lakes-fleet) and the [QuickBooks Bi‑Directional Sync](/case-studies/lakeshore-quickbooks)—demonstrate measurable ROI, from cost savings to revenue uplift.
From data engineering and SQL consulting ([SQL consulting](/services/sql-consulting)) to custom software development and systems integration, we deliver end‑to‑end solutions without relying on third‑party subcontractors.
Our platforms meet ISO 27001, SOC 2, and Michigan’s data‑privacy statutes, protecting sensitive operational and financial data while enabling secure collaboration.
With an on‑site team in Detroit, we can attend to issues within hours, not days, ensuring business continuity for mission‑critical operations.
Explore all our software services in Detroit
Let’s build a sensible software solution for your Detroit business.